

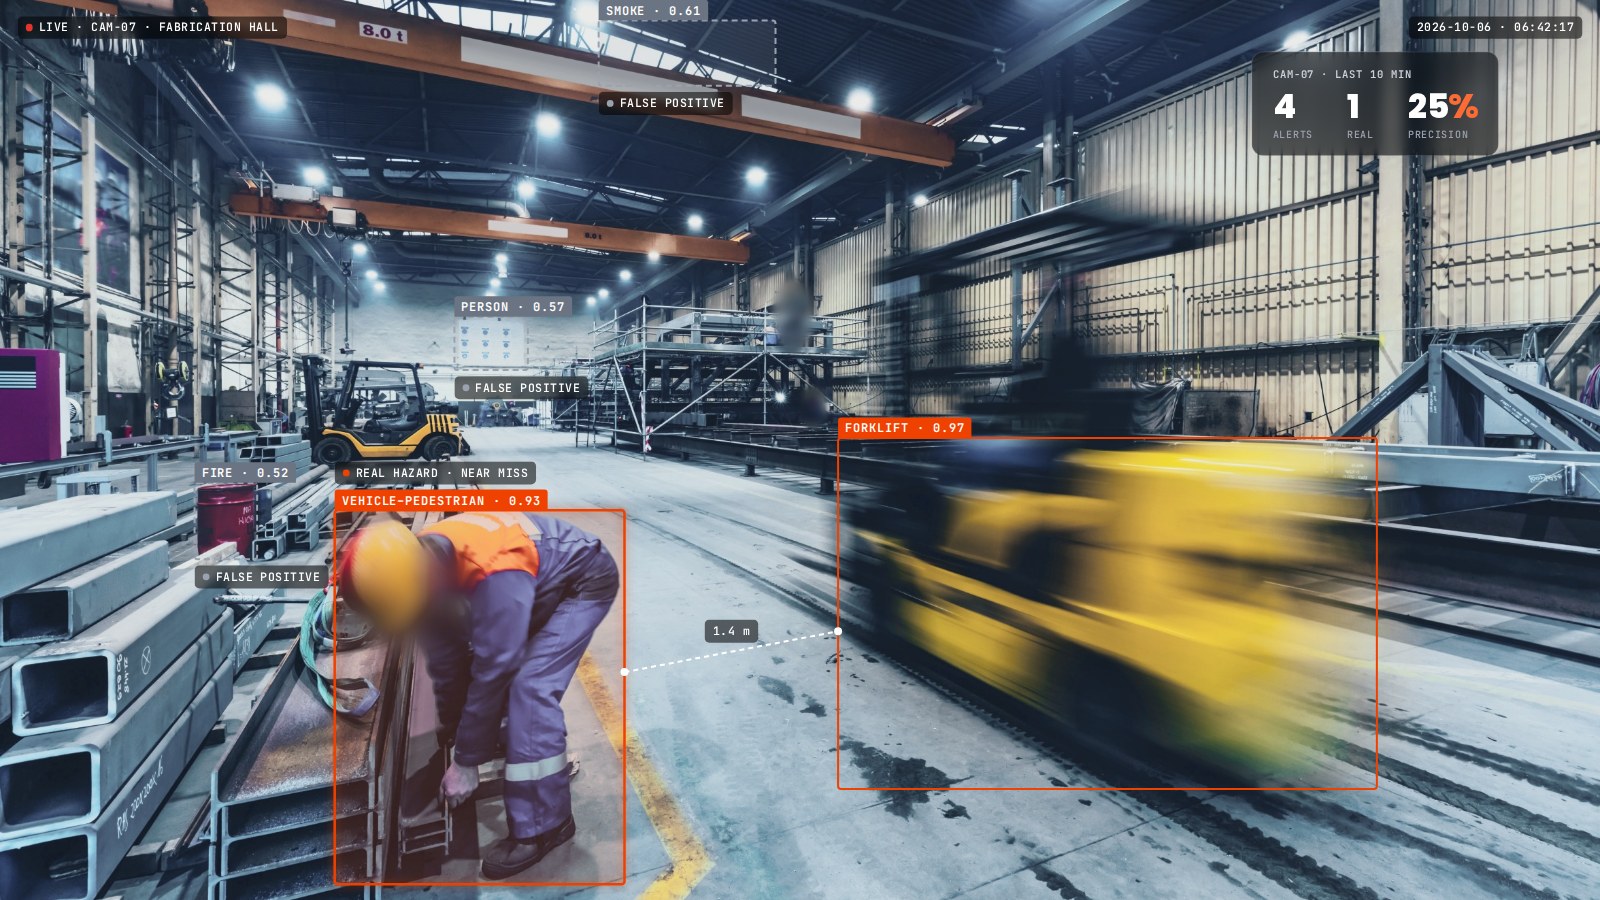
Written for EHS directors, site safety managers and operational excellence leaders, and for anyone who has watched a promising monitoring tool die in its first month.
Most computer-vision safety deployments don’t fail because the model misses hazards. They fail because it flags too many things that aren’t hazards, and the people on the receiving end stop looking. The failure is behavioural, it’s predictable, and it usually plays out within three weeks of go-live. Week one is enthusiasm. Week two is triage. Week three is the mental filter that files every alert under “probably nothing again.”
This isn’t speculation. It’s one of the most consistently replicated findings in every field that has industrialised alerting:
Workplace safety AI inherits exactly this dynamic, with one aggravating factor. The people receiving the alerts (safety managers, shift leaders, line supervisors) already have full-time jobs, and alert triage isn’t one of them. The margin for noise on a plant floor is thinner than in a SOC, not wider.
The fix isn’t a better launch-day accuracy number. It’s a calibration discipline: per-camera baselining, a bounded tuning period with a numeric false-positive target, weekly measured accuracy reporting, and an operating model that treats precision as something you manage every week, not a claim in a brochure. Below are the evidence, the arithmetic, and a checklist you can apply to any pilot, including ours.
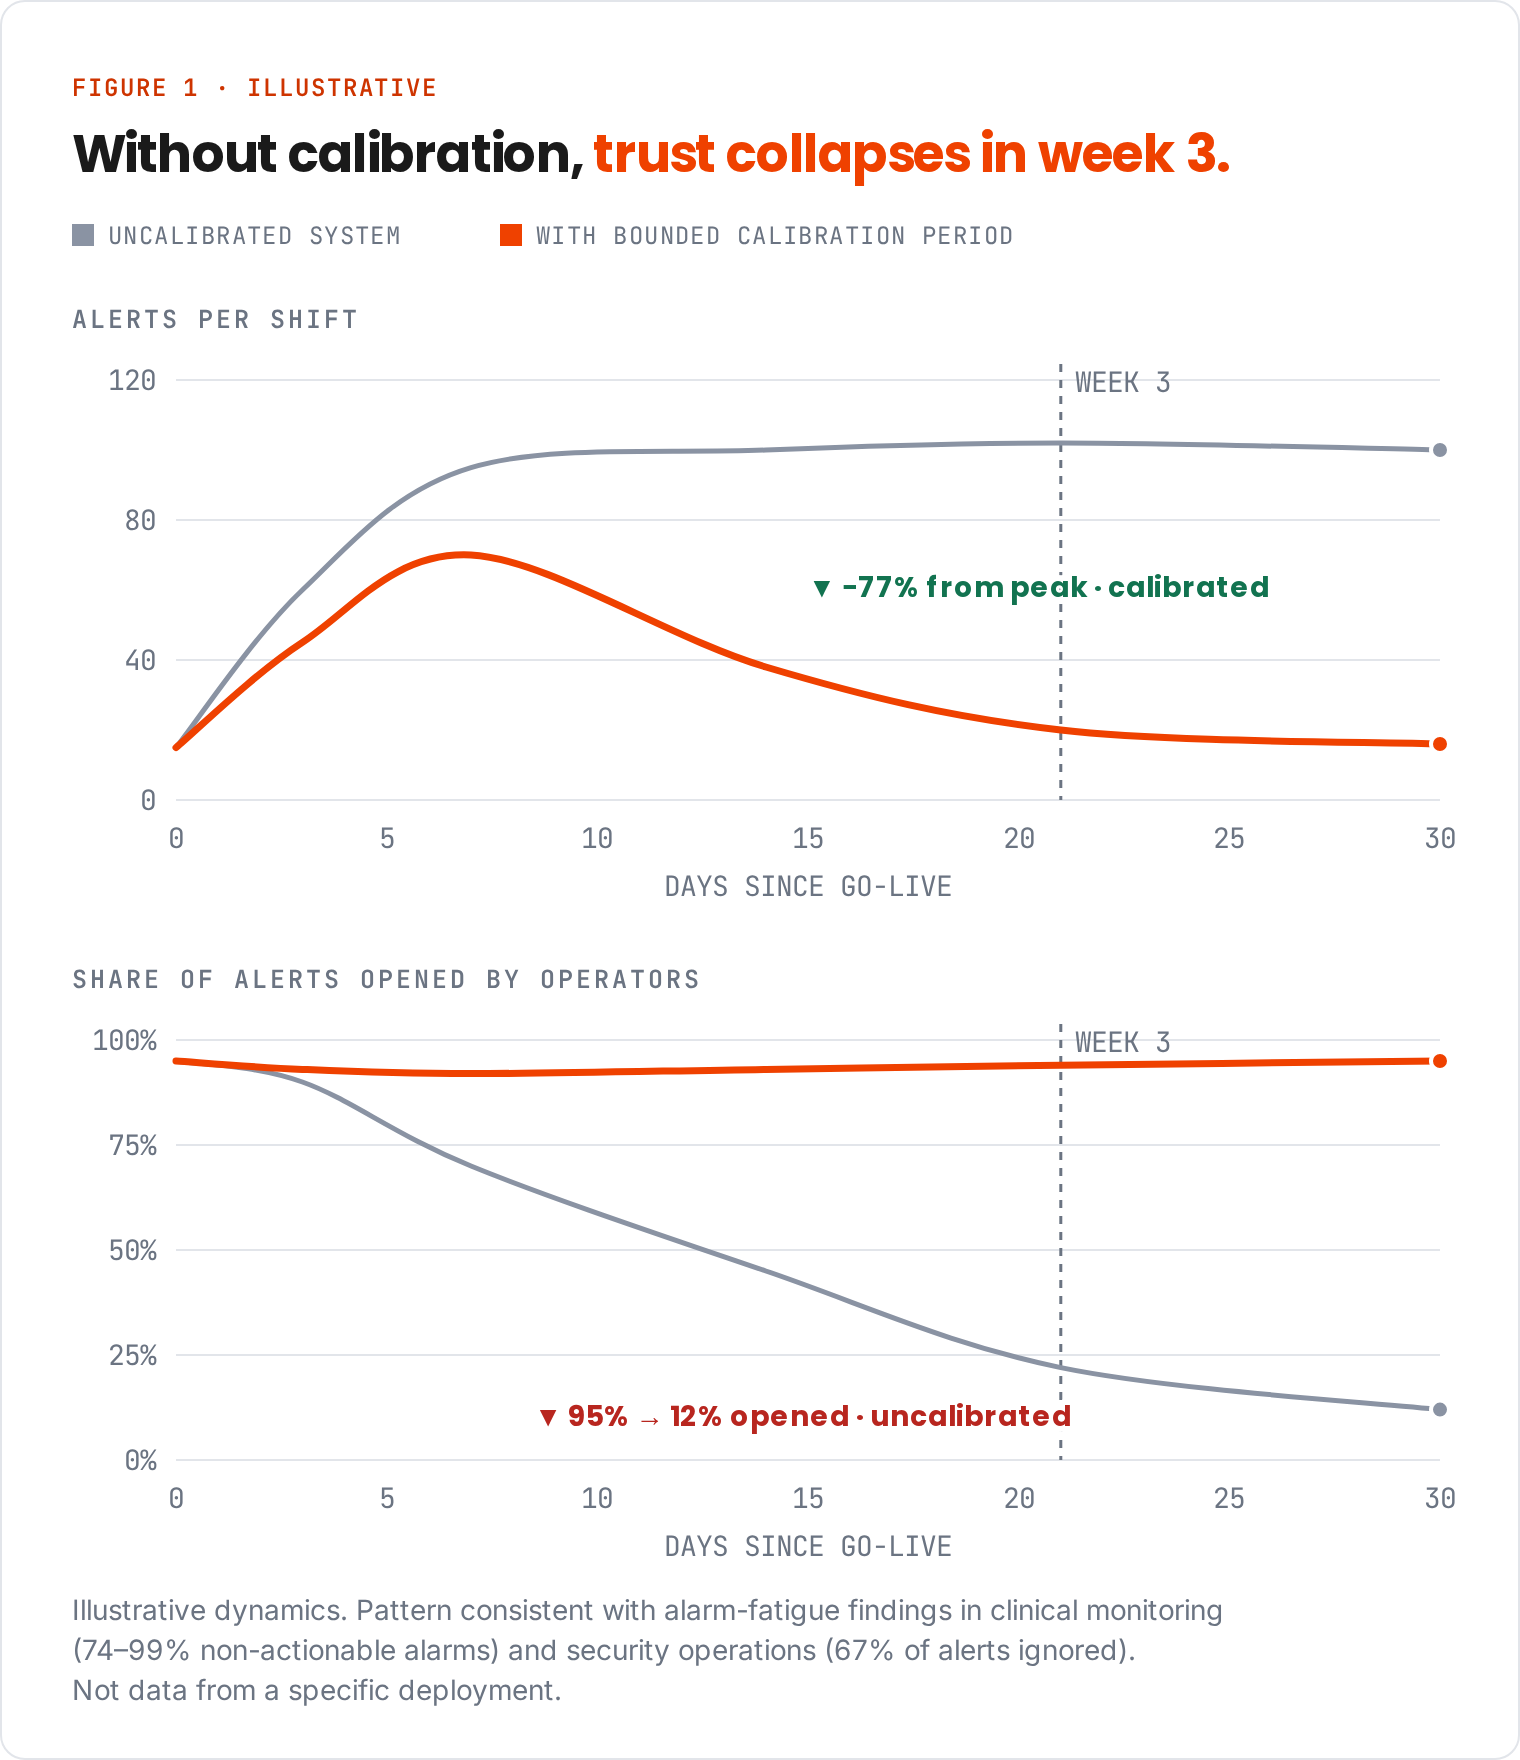
Every monitoring discipline that scaled up alerting has rediscovered the same law: human attention is a finite resource, and false alarms drain it faster and faster. The psychology is old (the “cry-wolf effect” has been studied since the 1980s), and the operational data is unambiguous.
Healthcare ran the experiment first and at the largest scale. Reviews of clinical alarm studies consistently find that 74–99% of physiological monitor alarms are non-actionable, and intensive-care monitors can exceed 350 alarms per patient per day. The documented consequences include delayed responses, alarms switched off, and patient deaths. That’s why alarm management became a named patient-safety goal in US hospital accreditation. The core finding transfers directly to industry: after a handful of false alarms in a row, operators stop trusting the channel itself, not just the individual alert.
Cybersecurity repeated it. Industry surveys report that around 83% of everyday SOC alerts are false positives, 73% of security teams name false positives as their top detection challenge, and 25–30% of alerts are never investigated at all because of overload. Tiered triage, suppression rules and correlation engines now form a whole sub-industry, and its existence is proof of the problem.
Physical security completed the pattern. Analyses of camera-based alarm systems report false-alarm shares as high as 98%. Police forces in several countries now fine repeat false alarms or stop responding to them. That’s distrust written into public policy.
The lesson for safety AI buyers isn’t that alerting is hopeless. It’s that alert volume and alert precision are core product variables, as important as what the system can detect. If a vendor tells you what their system detects but not how its precision is measured, managed and reported, you’ve had half a conversation.
Here’s the calculation every buyer should run before a pilot. It explains week 3 better than any anecdote.
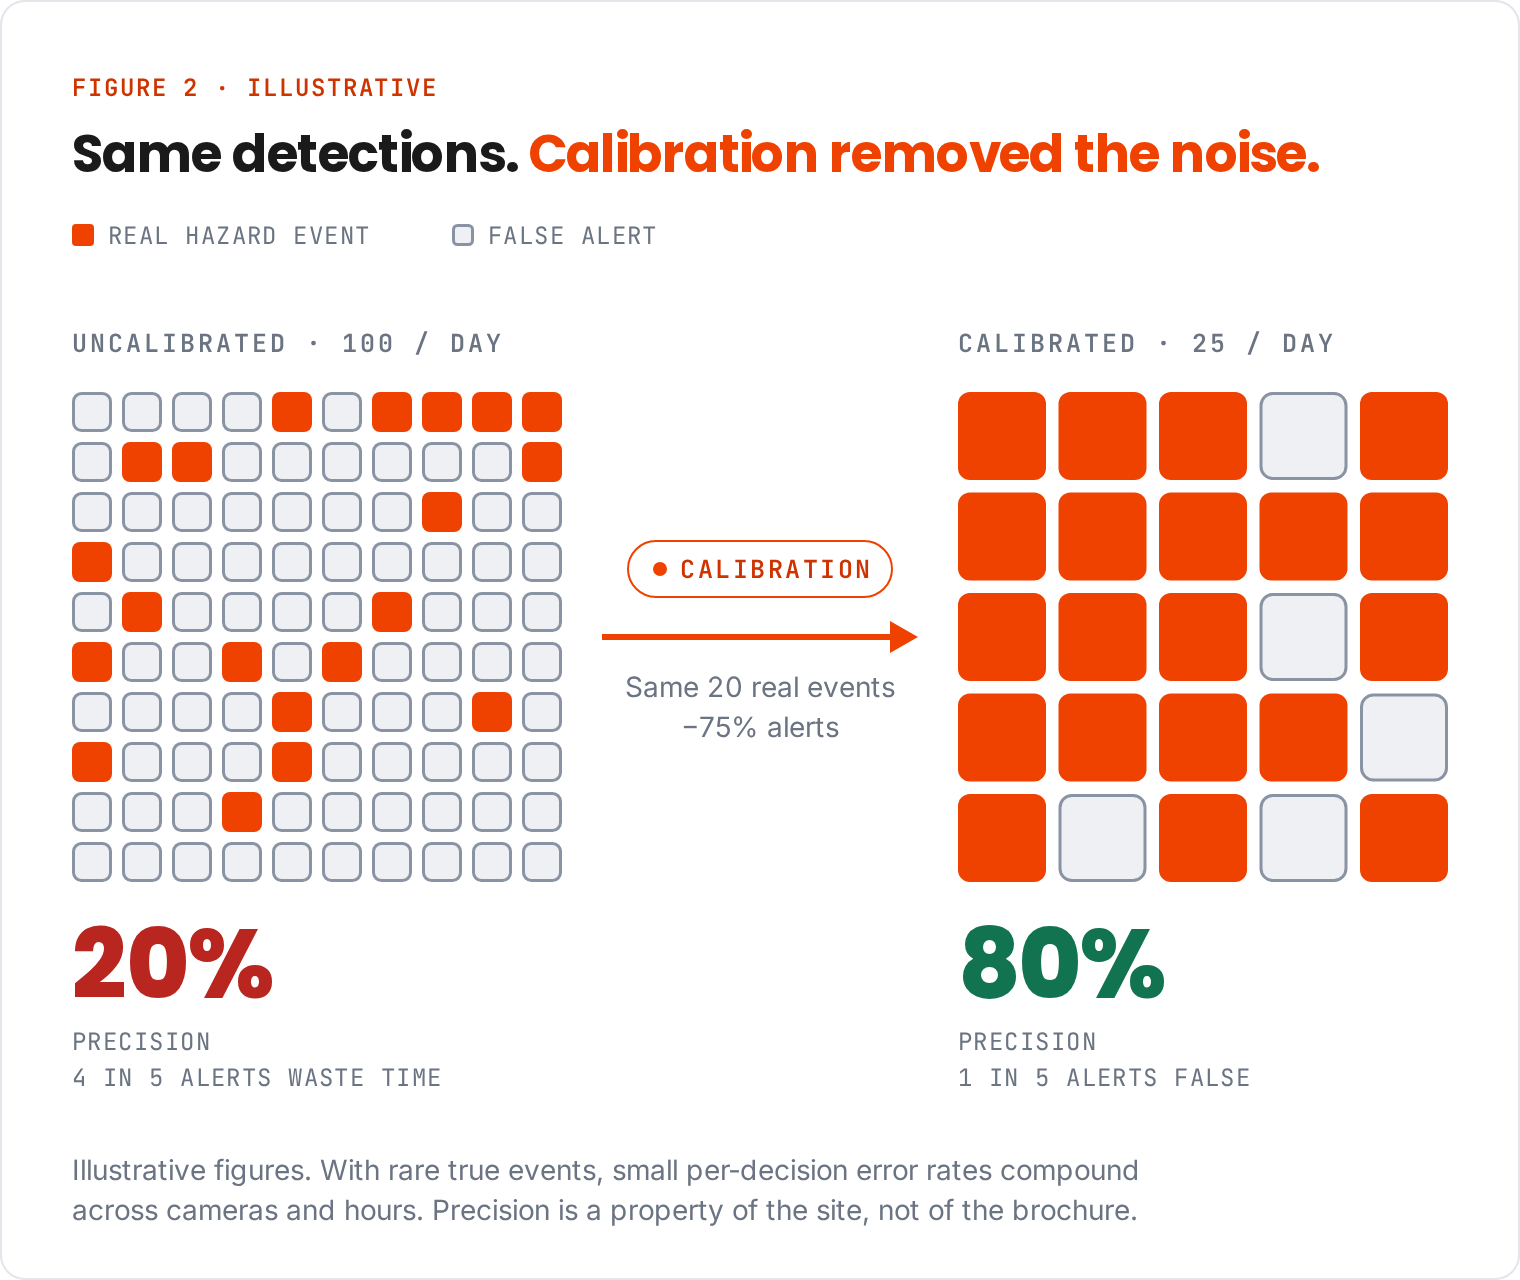
Take a mid-sized site with 40 cameras watching continuously. In effect, the system makes thousands of classification decisions per camera per day. Real hazard events, meanwhile, are rare, which is exactly what makes them worth catching. Rare targets are the worst case for precision. This is the base-rate problem: even a low per-decision false-positive rate, multiplied across 40 cameras and 24 hours, can produce false alerts that outnumber real events many times over.
With illustrative numbers: a site has 20 real hazard events a day and the system raises 100 alerts. Precision is 20%. Four out of five alerts waste an operator’s time, and within weeks the system has trained its users to ignore it. Cut the stream to 25 alerts a day with the same detections and precision jumps to 80%. That’s the difference between a channel people trust and a channel people mute. The model’s headline accuracy is identical in both scenarios. What changed is calibration to the site.
Three practical consequences:
The failure has a repeatable anatomy. It’s worth naming each stage, because each one is observable, and each one can be interrupted.
Days 1–5: the novelty surplus. Every alert gets opened. False positives are forgiven, even enjoyed, and screenshots get passed around, because the system is new and the real catches are genuinely impressive. Management sees the first dashboard and is delighted. This is the most dangerous phase: the deployment looks like a success while the alert economics are already unsustainable.
Days 6–12: silent triage. Operators build private rules of thumb: ignore that camera, ignore that rule after dark, check alerts twice a shift instead of live. Response times stretch. Nobody reports it, because it feels like efficiency, not failure.
Days 13–21: the trust collapse. The rules of thumb harden into a norm, and the norm spreads (“don’t bother with the walkway ones, it’s always the shadow”). The one real near miss that arrives on day 19 gets the same treatment as the noise. In hospitals, this is the documented mechanism by which alarm fatigue kills. On an industrial site, it’s how a safety system turns into shelfware with a subscription.
Day 22 onward: the quiet renegotiation. Alerts get rerouted to an inbox nobody owns. The vendor’s quarterly review shows detection counts going up. The site’s engagement numbers have collapsed. Six months later the renewal conversation is about price, because nobody can say what the value was.
The key point: every stage leaves measurable traces: alert volumes, open rates, time-to-acknowledge, false-positive share per camera. A deployment that tracks these from day one can see the collapse coming ten days before it happens. A deployment that only counts detections can’t. These are leading indicators for the safety system itself, and they deserve the same attention as the leading indicators it reports from the floor.
Deployments that survive month three rarely differ from the ones that don’t in model architecture. They differ in whether calibration was run as a bounded, measured, openly reported process. That discipline has five parts.
For the first days after connection, the system observes and the team measures. What does each camera see? What does the raw alert stream look like? Which rules fire, on which zones, at which hours? Nobody should be asked to act on alerts during baselining, and nobody should be shown a dashboard presented as the truth. The baseline is the denominator for everything that follows, including the before-and-after evidence the deployment will one day owe its budget sponsor.
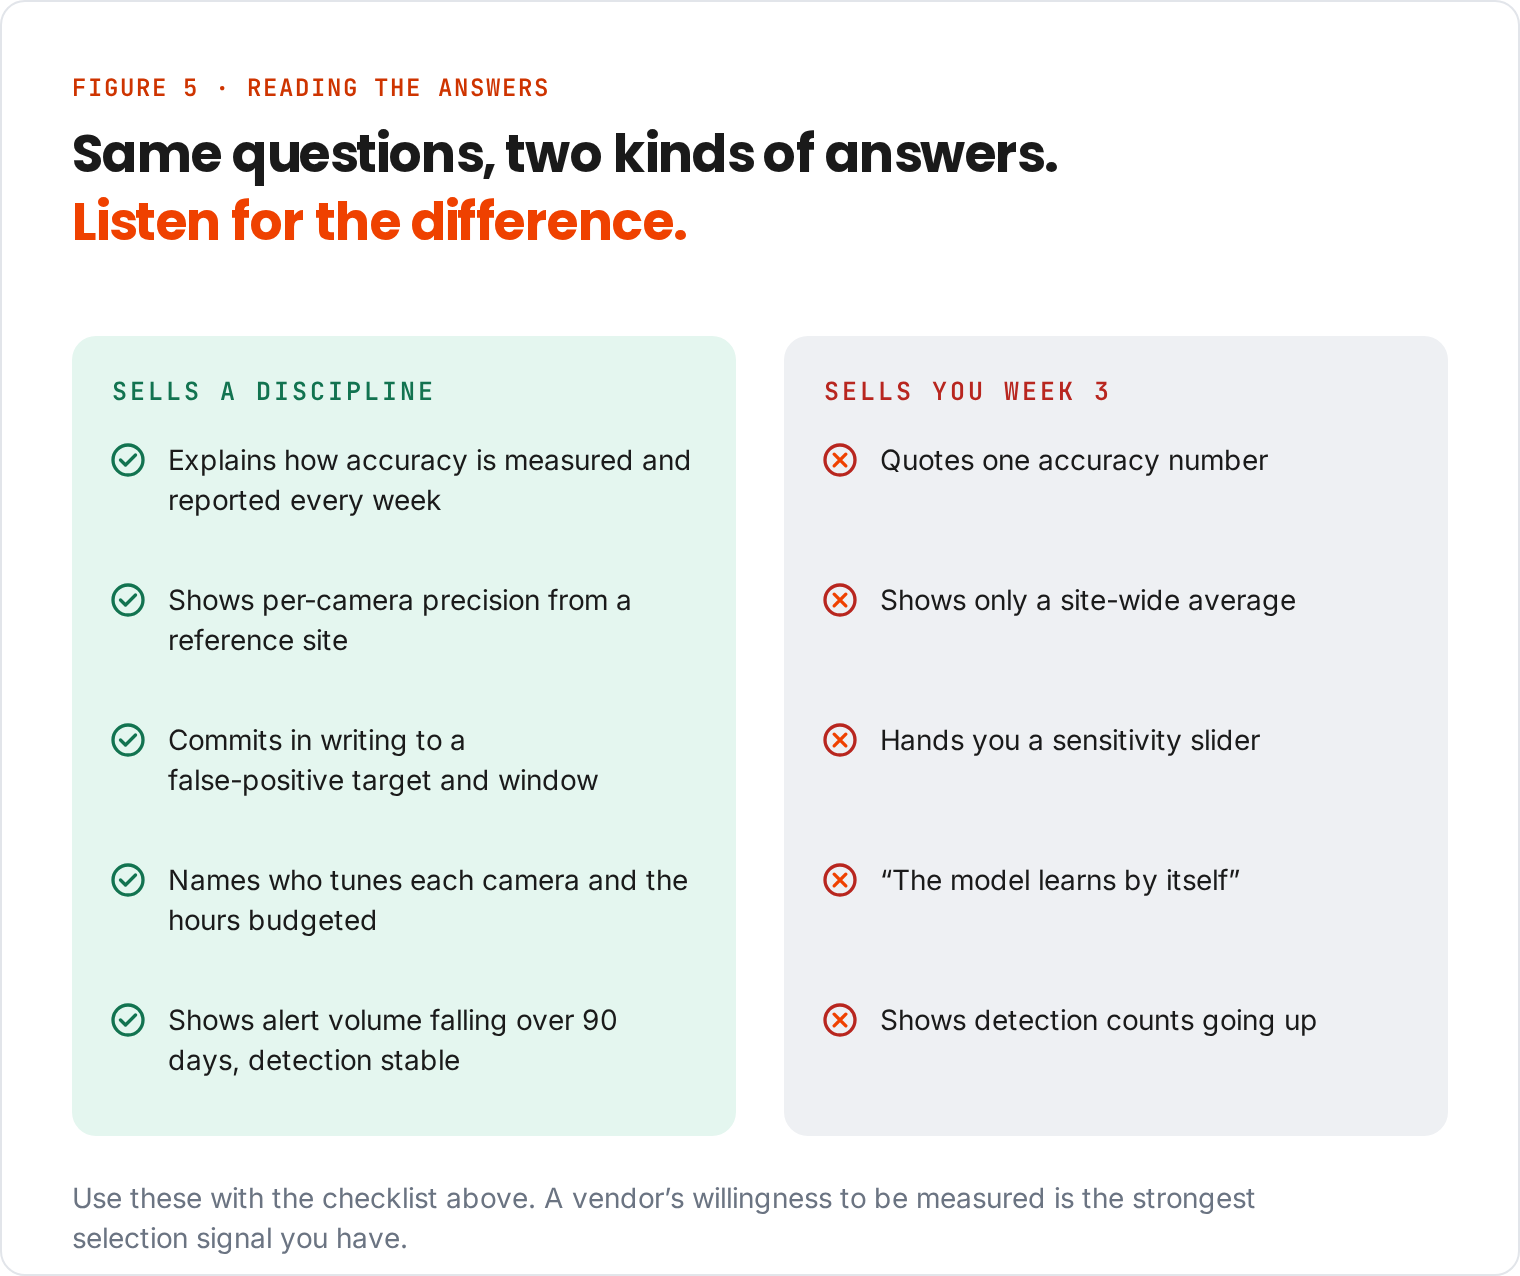
Calibration without a number and a deadline is just vibes. Good practice is an explicit target: within a fixed calibration window (measured in days, not quarters), false positives below a stated share of alerts, measured per use case and per camera. For example, a two-week window with a single-digit false-positive target. The exact numbers matter less than three things. The target is written down before the pilot starts. It’s measured by counting, not by impression. And it’s validated openly with the customer, alert by alert, in a shared review. A vendor’s willingness to be measured this way is one of the strongest selection signals you have. Even so, treat the figure as a target to be demonstrated, not a contractual guarantee to be assumed.
Industrial sites defeat generic models in mundane ways. Reflective vests that read as missing from certain angles. Steam plumes that read as smoke. A convex mirror that doubles every forklift. Fixing these isn’t retraining from scratch. It’s systematic per-camera work: zone masks, threshold adjustments, rule scheduling (the dock-door rule doesn’t need to run when the dock is closed), and model feedback on the site’s specific visual quirks. The question to ask any vendor: who does this work, how many hours are budgeted, and how do we see its effect week over week? A vendor with dedicated data specialists doing tuning as a service is describing a process. A vendor who hands you a sensitivity slider is describing your future weekends. Privacy matters here too. Tuning means reviewing event clips, so review should run on de-identified footage by default (faces and bodies blurred or shown as silhouettes). The job is to find the missing hard hat, never to identify who wasn’t wearing it.
After go-live, precision is a managed metric, permanently. The rhythm that works is a weekly accuracy report that gives a weighted average across active use cases and shows the per-camera distribution. That way a degrading camera (new lighting, moved racking, a seasonal change in sun angle) is caught by the report, not by operators quietly learning to ignore it. Accuracy drifts in production. Sites change, seasons change, camera housings get dirty. A ~95% weighted average that is measured and continuously reported is worth more than any launch-day claim, precisely because it can be proven wrong every week.
Calibration ends with an explicit agreement with the people on the receiving end. Which alerts arrive in real time, and to whom? Which roll up into a daily digest? Which only show up as trends on a dashboard? One rule of thumb holds in every alerting discipline: if an alert type has no named owner and no defined response, it shouldn’t be a real-time alert. Severity tiers, zone routing and digest windows keep a safety team in the loop without drowning in the stream. And the loop always ends with a person: the system flags, people decide what happens next.
Deployments run this way produce a signature that is the exact opposite of the week-3 curve: alert volume falls, detection of real events holds, and engagement stays high. Published and customer-reported figures from industrial safety AI show the size of the effect. Each is specific to one site, scope and period, so read them as proof that it can be done, not as promises: a European refinery recorded an 85% reduction in alerts over six months while PPE compliance rose; a steel plant recorded 90% fewer total alerts and 92% fewer vehicle–pedestrian near-traverse alerts over six months; a combined heat-and-power operator recorded an 89% reduction in total alerts. Fewer alerts with detection maintained is what a system earning trust looks like in the data.
Every industrial site fools generic vision models in its own dialect, but the failure families repeat. Knowing them makes vendor conversations concrete. Instead of “how accurate is it?”, ask “how do you handle these five, and can I see the per-camera evidence?”
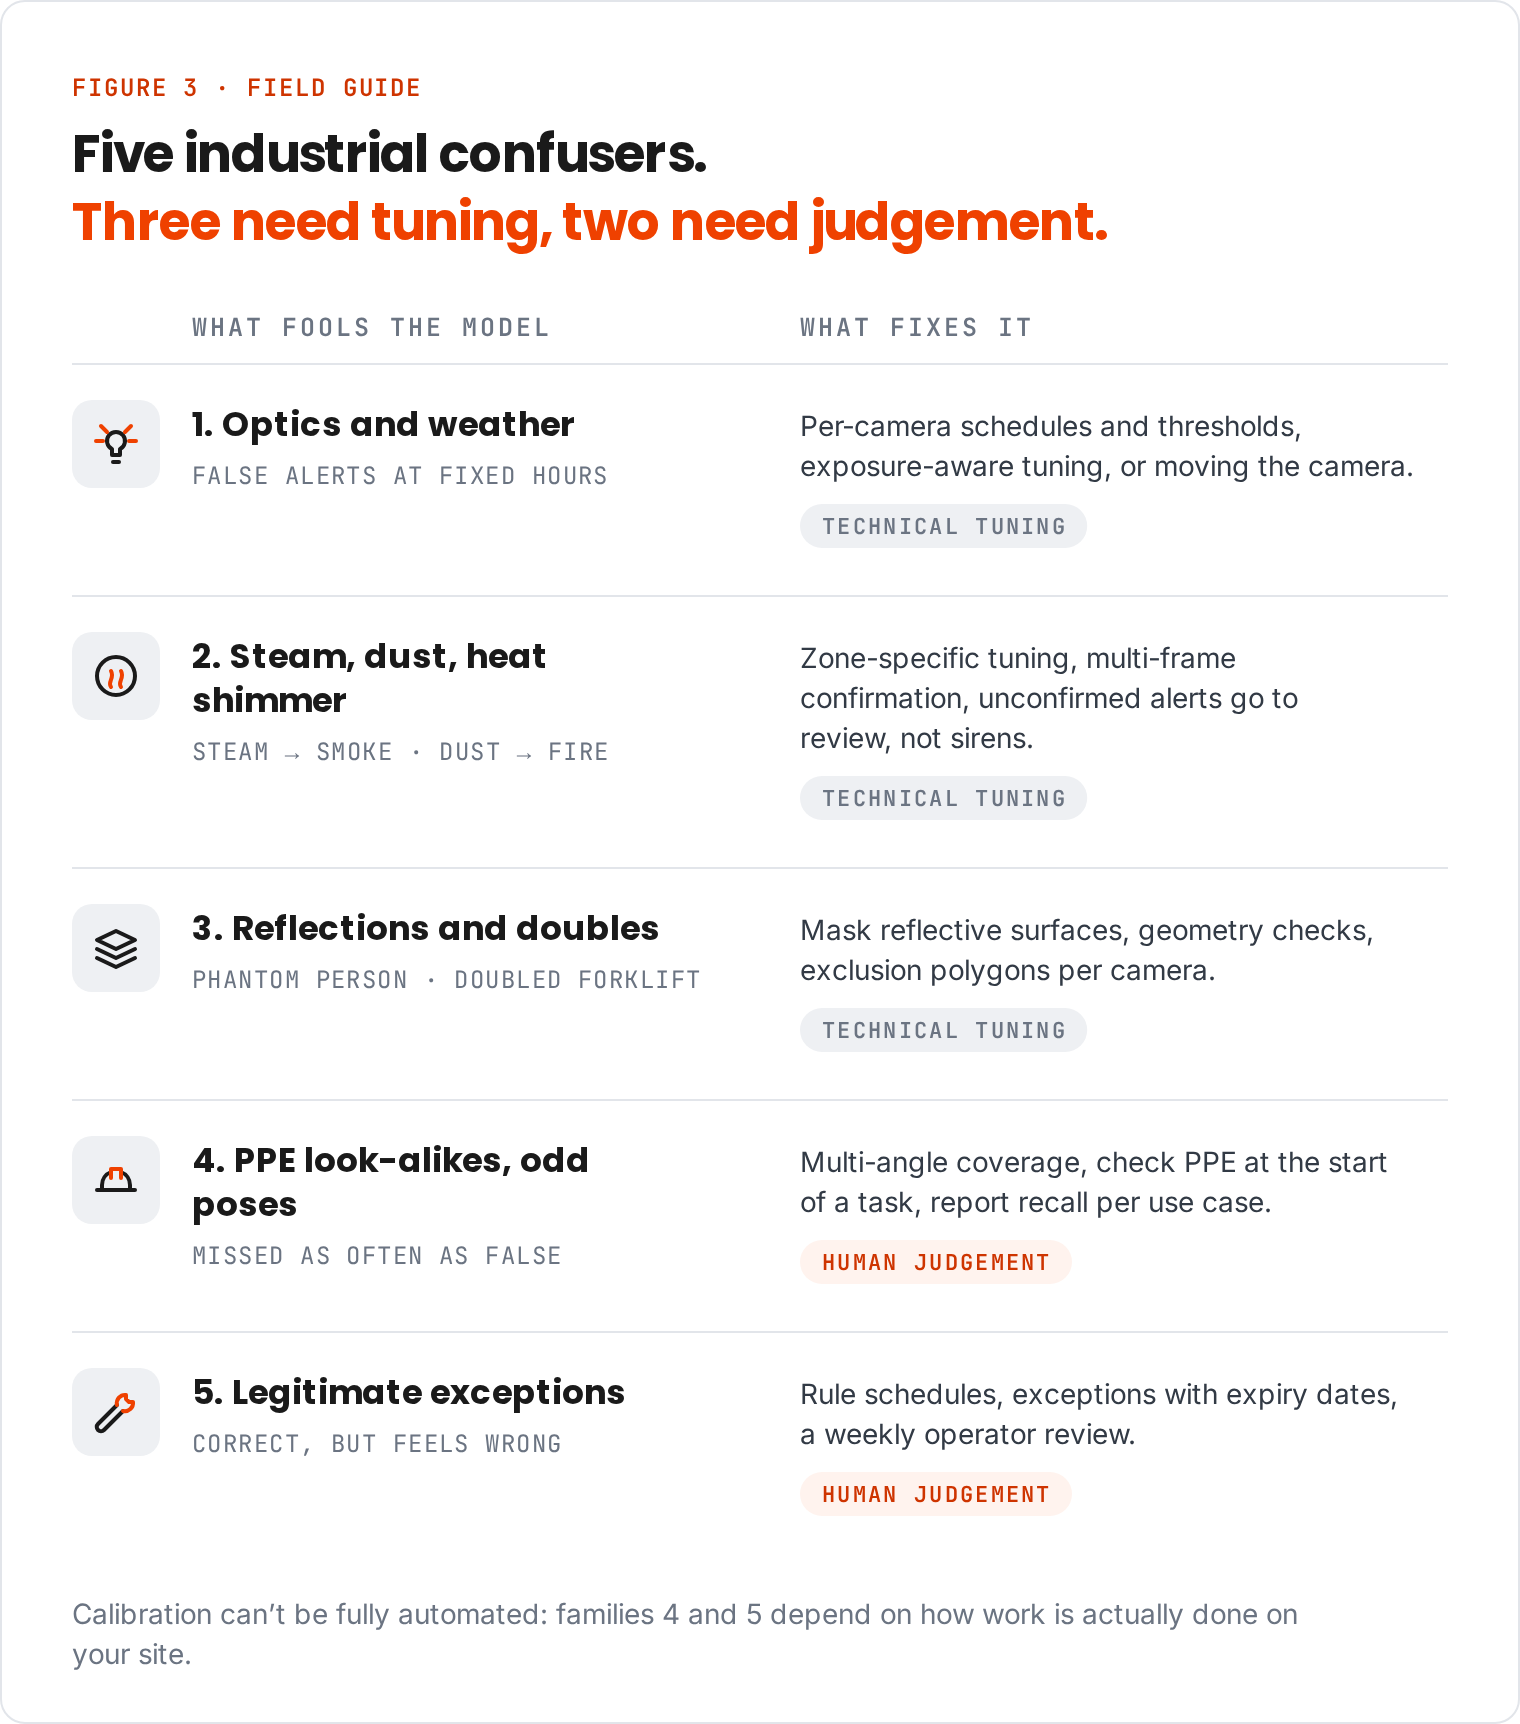
1. Optics and weather. Low sun through dock doors, lens flare, rain and snow on camera domes, fog, condensation cycles in cold stores. Signature: false positives clustered at specific hours and seasons on specific cameras. Fixes: per-camera scheduling and thresholds, exposure-aware tuning, and sometimes the honest answer that a camera needs moving or a hood. A vendor willing to say “move the camera” has a healthy calibration culture.
2. Steam, dust and heat shimmer. The heavy-industry classics: steam read as smoke, dust clouds read as fire, shimmer distorting person detection near furnaces. Signature: false alarms on critical rules like smoke and fire. These are the most expensive false positives in the system, because they trigger the most disruptive responses. Fixes: zone-specific tuning, multi-frame confirmation, and severity-tier routing so unconfirmed detections arrive as items to review, not sirens.
3. Reflections and doubles. Polished floors, glass partitions, mirrors, wet surfaces after cleaning: each can double a forklift or put a phantom person inside an exclusion zone. Signature: physically impossible detections, like a person “inside” a wall or the same vehicle in two places. Fixes: masking reflective surfaces, geometry checks, and per-camera exclusion polygons drawn during calibration.
4. PPE look-alikes and awkward poses. High-vis rain covers over helmets, hoods over hard hats, gloves the same colour as sleeves, a worker bent over a machine with the helmet out of view. Signature: false negatives as often as false positives, which is the dangerous combination. Fixes: multi-angle coverage of critical zones, pose-aware detection windows (check PPE at the start of a task, not mid-crouch), and honest reporting of recall per use case, not just precision.
5. Legitimate exceptions. The maintenance crew authorised inside the fence. The forklift that has to cross the walkway during changeover. The zone whose rules change by shift. Signature: technically correct detections that operators experience as false, because the context says “allowed.” These do the most damage to trust, because the system doesn’t look wrong, it looks stupid. Fixes: rule scheduling, exception workflows with expiry dates, and a weekly review where operators nominate rules for adjustment. A calibration process without an operator feedback loop will win on the precision statistics and lose the room.
The field guide also shows why calibration can’t be fully automated. Families 1–3 yield to technical tuning. Families 4–5 need human judgement about how work is actually done on that site. That judgement is the “discipline” in calibration discipline.
Precision language gets slippery in sales conversations, so pin the definitions down in writing before the pilot starts:
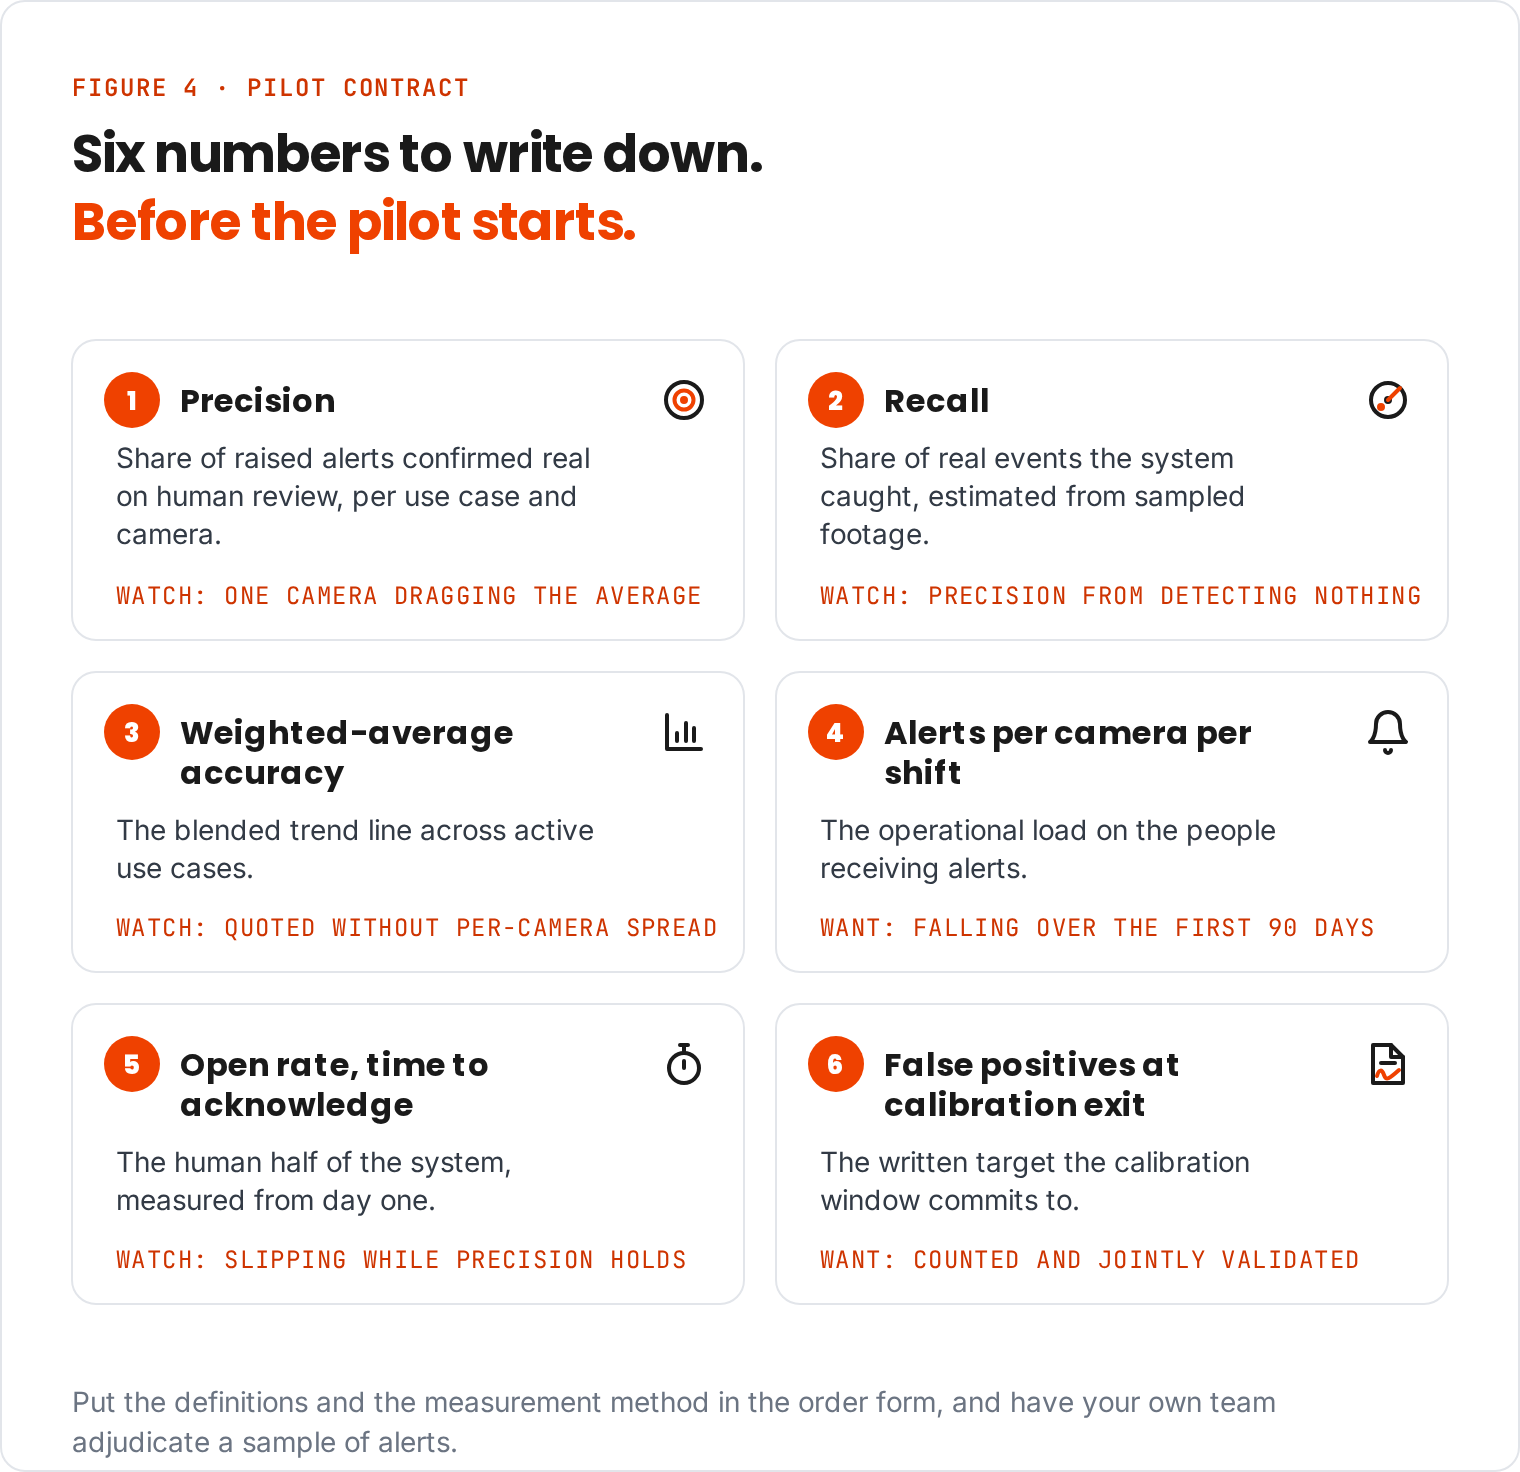
Two governance notes. First, insist that your own team adjudicates a sample of alerts during validation. Homework marked by the vendor converges on flattering numbers. Second, agree that the measurement rhythm survives go-live: weekly accuracy report, monthly per-camera review, quarterly recalibration check. Deployments keep their week-one discipline exactly as long as the reporting cadence forces them to.
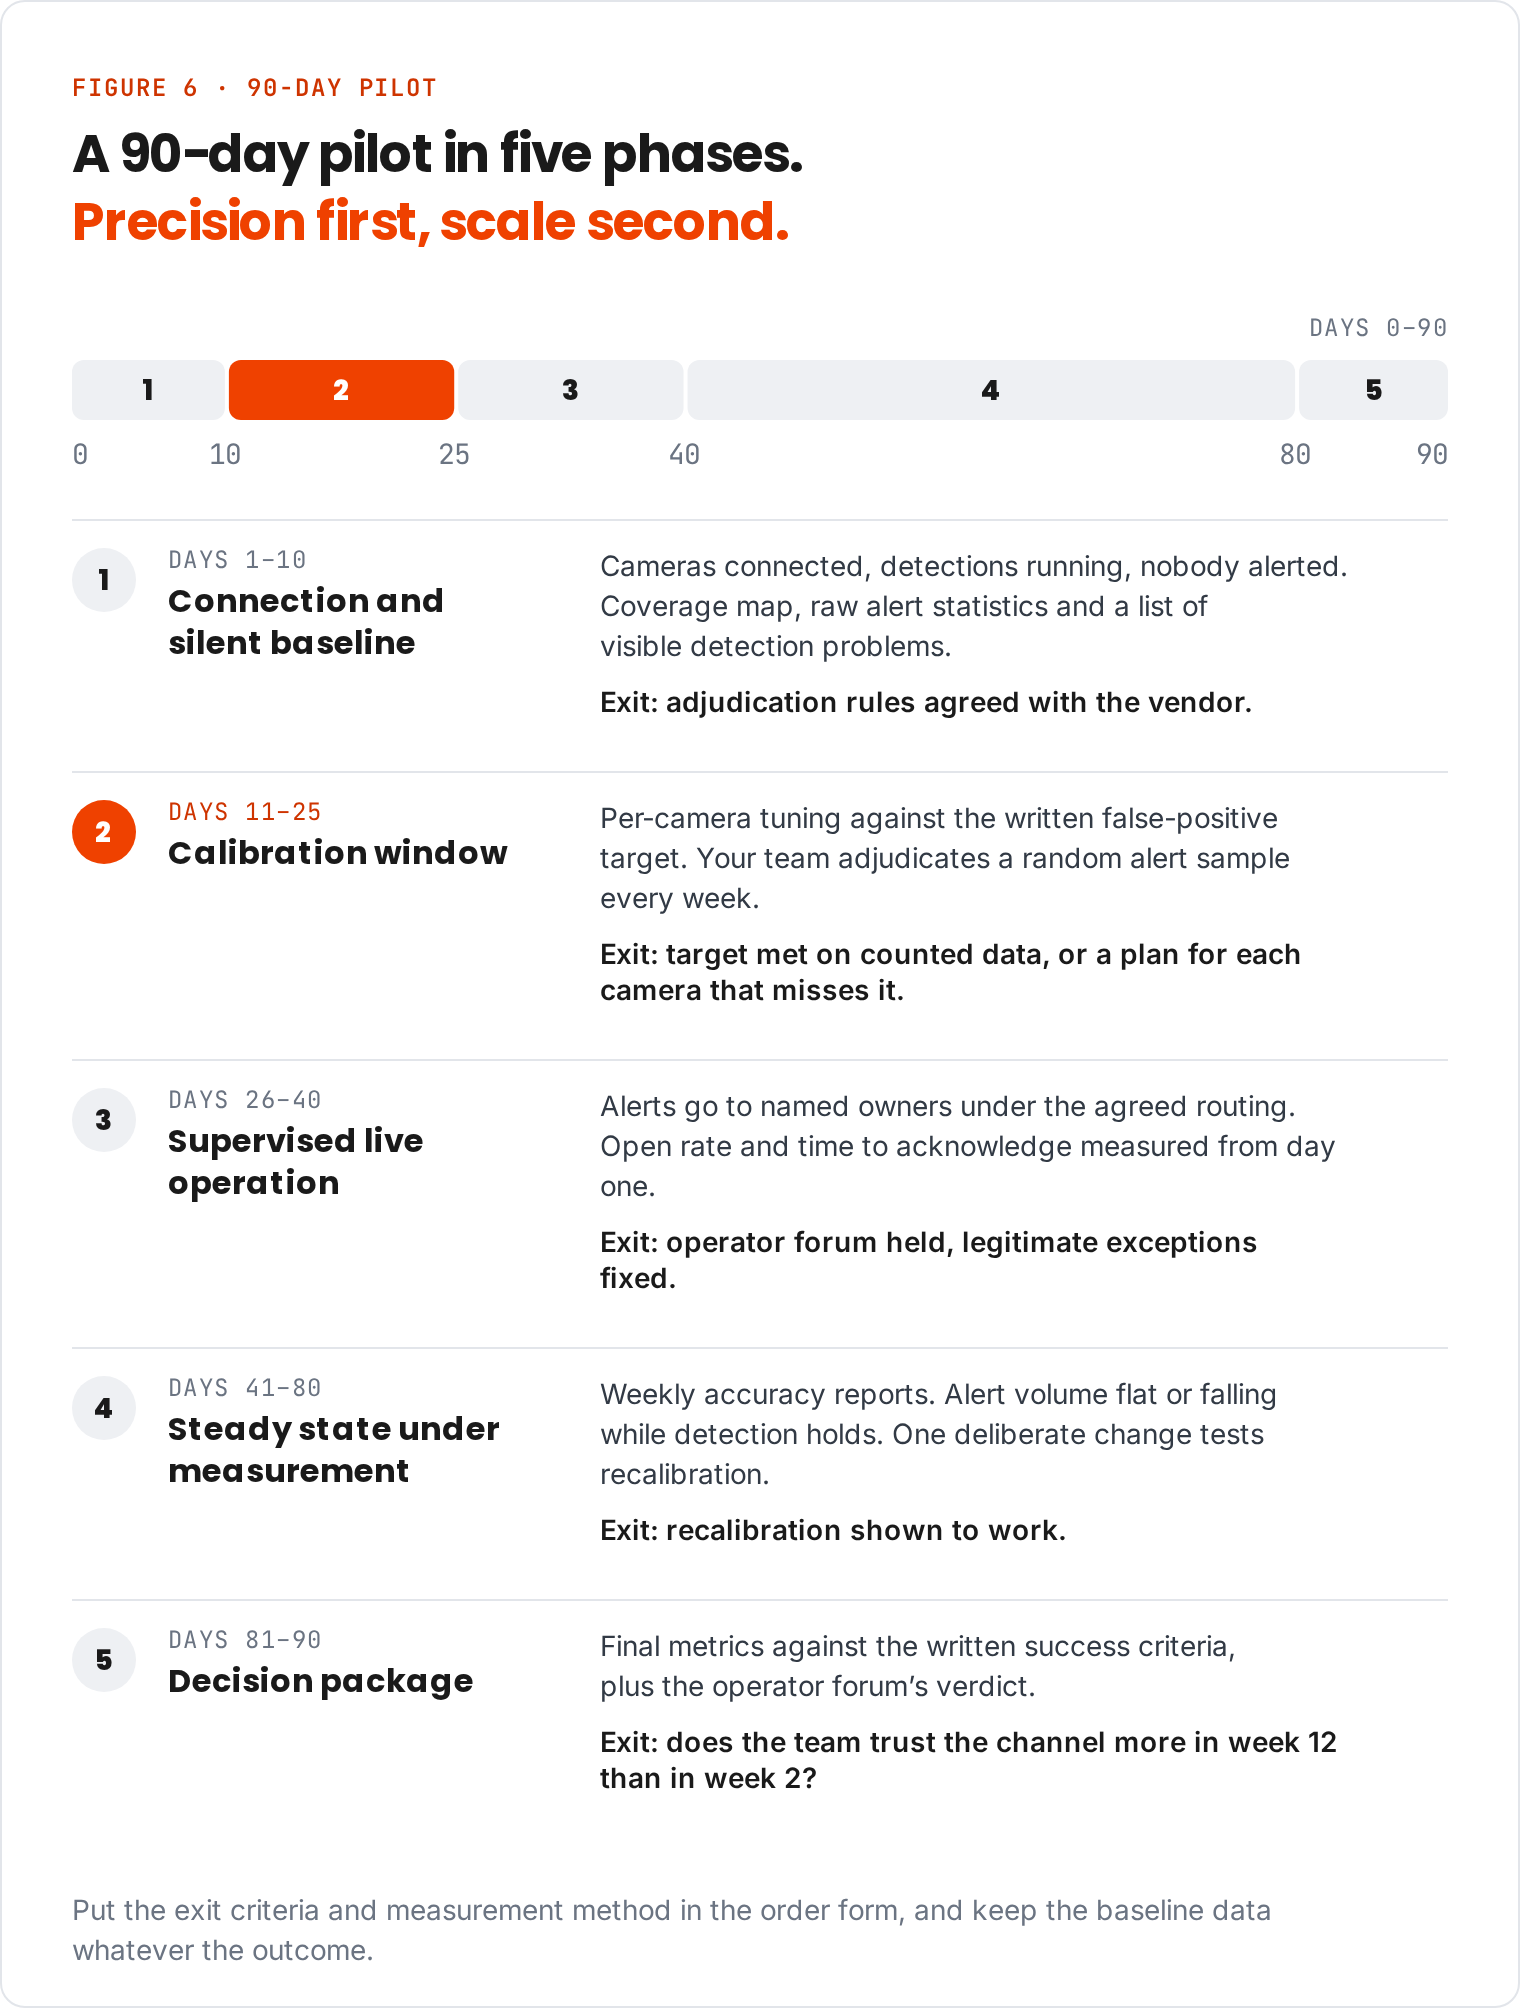
Here’s the discipline as a schedule you can adopt as it stands:
Short answers to the questions EHS and operations leaders ask most often about false positives, alert fatigue and calibration in AI safety monitoring.
A false positive is an alert that an AI safety system raises for something that isn't a real hazard, such as steam flagged as smoke or a reflection flagged as a person inside an exclusion zone. In computer-vision safety monitoring, false positives matter as much as missed hazards. A high false-positive rate trains EHS teams and supervisors to ignore alerts, including the real ones.
Most AI safety deployments fail because of alert fatigue, not because the model misses hazards. When an uncalibrated system floods safety teams with false alarms, operators stop responding, usually within about three weeks of go-live. Other fields document the same pattern: clinical studies find that 74–99% of hospital monitor alarms are non-actionable, and security operations centres report similar overload.
Alert fatigue is the loss of trust and response that sets in when people receive too many alerts that turn out to be false or irrelevant. In workplace safety AI, it shows up as slower acknowledgement times, falling open rates and informal rules such as “ignore that camera.” Eventually a real near miss gets treated as noise.
No. A vendor that claims zero false positives isn't measuring them. The realistic goal is precision high enough that every alert deserves attention. That precision should be measured per camera and per use case and reported weekly, so it holds as lighting, layouts and seasons change.
Ask for measurement before you ask for a number. A credible vendor reports a weighted-average accuracy across use cases, shows the per-camera distribution, and updates both every week. A continuously measured accuracy of around 95% is auditable. An unmeasured claim of 99% is marketing. Treat any accuracy figure as measured, not guaranteed.
Calibration should take weeks, not quarters. A common structure is a short silent baseline, then a calibration window of about two weeks. That window has a written false-positive target, measured per camera and validated jointly with the customer. Be wary of a vendor with no calibration period, and equally of one whose calibration never ends.
False positives come down through site calibration, not a new model. The main tools are per-camera zone masks, threshold tuning, rule schedules, multi-frame confirmation for smoke and fire, and alert routing by severity. The most common causes on industrial sites are low sun and weather, steam and dust, reflections, PPE look-alikes, and legitimate exceptions such as authorised maintenance work.
Start with one or two use cases and calibrate them to trustworthy precision before adding more. Early precision builds the operator trust that later use cases inherit. Launching broad coverage on day one tends to reproduce the week-3 alert-fatigue curve at enterprise scale.
Not necessarily, but better detection alone won't fix it. Ignoring noisy motion alerts is rational behaviour, as alarm-fatigue research shows. AI safety alerts hold attention when the alert stream is designed with the team. Every real-time alert has a named owner and a defined response, and everything else goes to a daily digest or a dashboard.
An AI safety pilot contract should define six metrics: precision per use case and per camera, recall estimated from sampled footage, weighted-average accuracy, alert volume per camera per shift, open rate and time-to-acknowledge, and the false-positive share at calibration exit. Put these definitions and the measurement method in the order form, and have your own team adjudicate a sample of alerts.
It doesn't need to, and privacy-first systems don't. Surveily, for example, detects objects, equipment, vehicles and behaviours, such as a missing hard hat, without facial recognition or any other biometric identification. Footage is de-identified by default, with face and body blurring applied before anything is stored or shown. People, not the system, decide what happens after an alert.
Surveily runs a bounded calibration period for every deployment, validated openly with the customer against a written false-positive target. Dedicated data specialists tune each camera. Customers get a weekly accuracy report with the per-camera view and a weighted average across use cases. That average is around 95% across deployments, measured and reported continuously, never guaranteed.
Wojtek Tubek is the founder and CEO of Surveily, a Wrocław-based company that turns the CCTV a site already has into a proactive, privacy-first safety system.
How we run calibration at Surveily. Every deployment starts with a bounded calibration period, validated openly with the customer against a written false-positive target. Dedicated data specialists tune each camera, and customers get a weekly accuracy report: a weighted average across use cases (around 95% across our deployments, measured and continuously reported, never guaranteed) plus the per-camera view. Video is analysed on site and de-identified by default before anything is stored or shown, and raw footage isn’t kept. The system flags; your team decides.
Planning a pilot? Take the checklist in section 7 into every vendor meeting, ours included. This article is educational. Deployment outcomes cited are specific to their site, scope and timeframe.


