

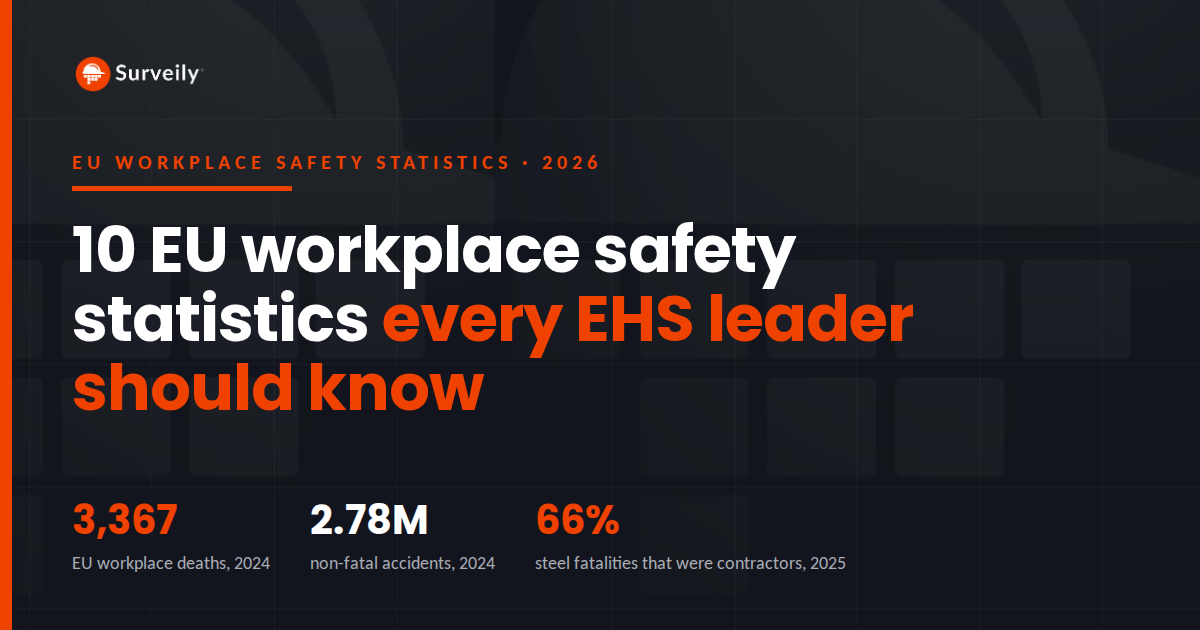
EU workplace accidents fell again. Workplace deaths didn't.
EU workplace safety data shifted in an important way in 2024: non-fatal accidents fell while workplace fatalities rose. Eurostat's latest release, published on 25 September 2026, records 2.78 million non-fatal accidents at work and 3,367 fatal accidents across the EU. That is 1.5% fewer non-fatal accidents than in 2023, and 1.4% more deaths.
For EHS leaders, the headline numbers are only the starting point. Accident counts don't show where serious-risk exposure sits, reported incidents don't capture every hazard, and industry-wide statistics can't tell you what is happening on your own sites.
So we chose these ten workplace safety statistics around one question: what can this number change about the way an EHS team manages risk? Each comes with its source, its year and the context you need to cite it safely. Where a number reflects survey perceptions rather than measured incidents, we say so. And one theme runs through all of them: reported risk isn't necessarily the same as real exposure.
Data status: 30 September 2026. The latest available year varies by statistic, because major safety datasets are published on different schedules.
The board problem: fewer accidents, not fewer deaths.
According to Eurostat's European Statistics on Accidents at Work (ESAW), there were 2.78 million non-fatal accidents at work in the EU in 2024, 1.5% fewer than in 2023. ESAW counts accidents that lead to at least four full calendar days' absence from work. Manufacturing recorded the most (509,851), followed by construction (352,520) and wholesale and retail trade (345,282). Frequency is falling. The question is whether serious-risk exposure is falling with it. Cross-country comparisons need care, though: they partly reflect differences in national reporting systems, not just differences in risk.
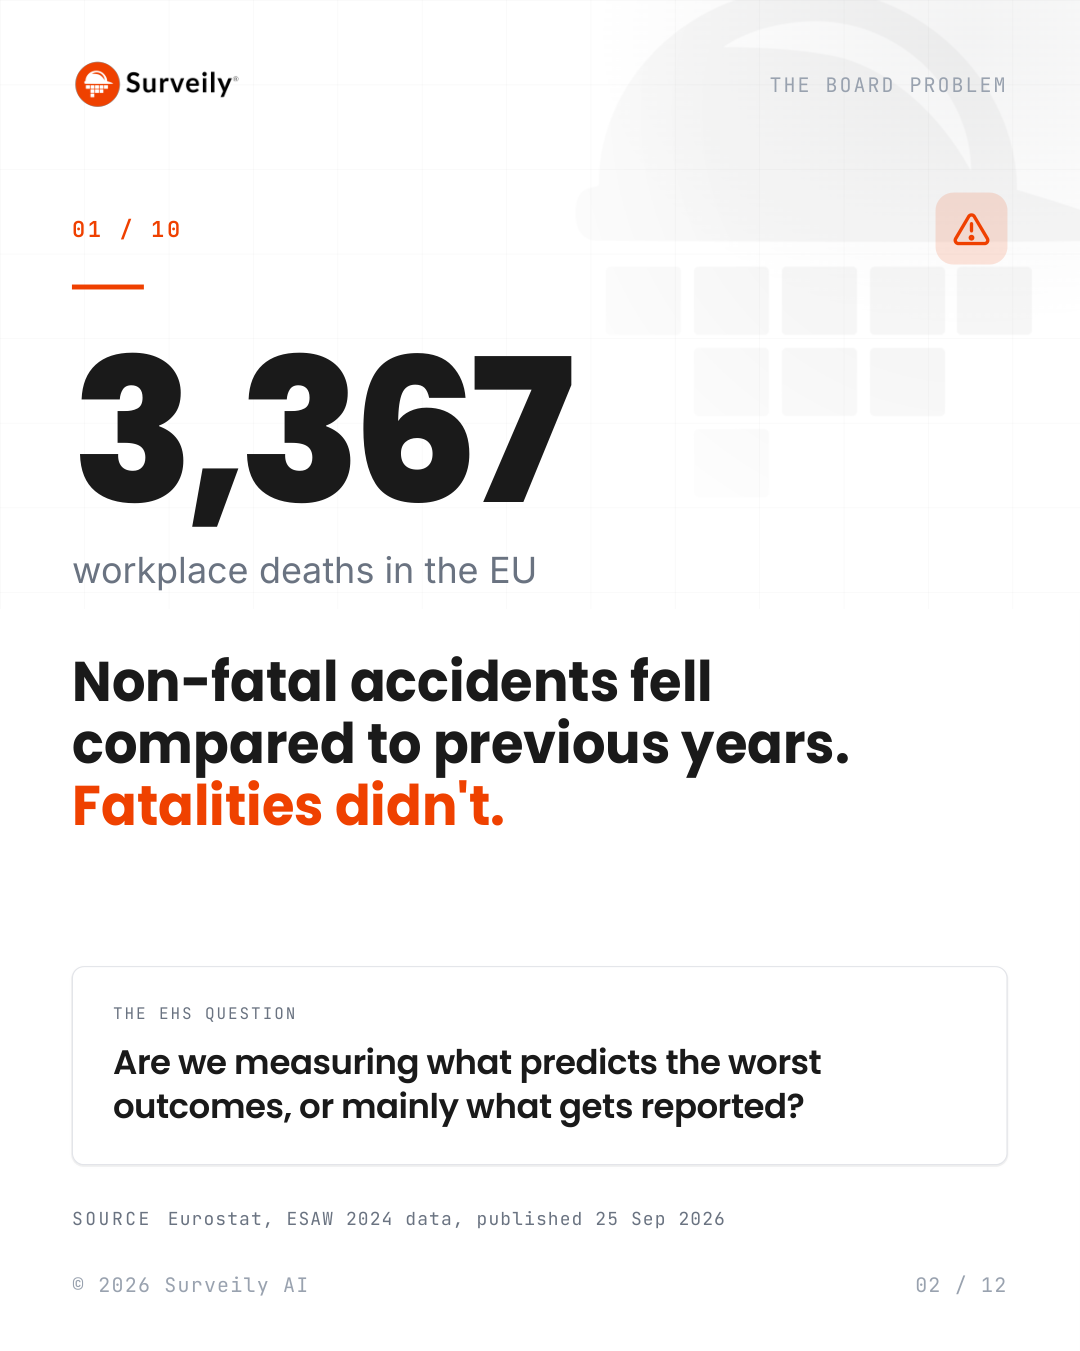
According to Eurostat, 3,367 people died in accidents at work in the EU in 2024, 1.4% more than in 2023, in the same year that non-fatal accidents fell. Construction recorded by far the most deaths (776), followed by transport and storage (537) and manufacturing (466). Eurostat revises earlier years as data arrives, so the year-on-year comparison here comes from within the same release.
This is the second Eurostat release in a row in which the non-fatal count went down while the fatal count went up. And it is one of the most important patterns in modern safety data: reducing minor incidents does not automatically reduce fatalities.
Eurostat notes that its figures by sector "are intended to show the overall volume and distribution of accidents across sectors, rather than differences in accident rates." A sector with more workers will record more accidents. For comparisons between industries, sites or countries, use an exposure-adjusted rate rather than raw counts: the EU's non-fatal accident incidence rate was 1,393 per 100,000 people employed in 2023, the latest rate Eurostat has published. Counts tell you how many events happened. Rates tell you how much exposure generated them.
The data problem: what macro numbers can and can't carry.
The European Agency for Safety and Health at Work (EU-OSHA) estimated in 2017 that work-related accidents and ill health cost the EU €476 billion a year, about 3.3% of GDP. It is useful for framing the scale of the problem, but it is not a business case. For the board, translate it into your sites, your incidents and your cost exposure.
An international study by the International Social Security Association (ISSA) measured a return of 2.2 for every unit invested in workplace prevention. It is the conservative, citable end of the prevention-economics literature: a benchmark, not a promise. Your own business case still needs your baseline, your cost assumptions and your site data.
The visibility problem: what never reaches the system.
In Benchmark Gensuite's 2026 EHS Benchmarking Report, 90% of the EHS professionals surveyed said incidents, hazards and near misses are going underreported, up from 79% a year earlier. In the same survey, 45% estimate that up to a quarter of employees don't report incidents at all. Your near-miss dashboard may be a floor, not a complete picture of exposure. For one practical approach, see how worker-reported and camera-detected events can sit side by side in ear-miss reporting without the form.
How to read it: the survey measures what EHS professionals perceive, not a counted rate of missing reports. Nine in ten EHS leaders see an underreporting problem; that is not the same as 90% of incidents going unreported.
According to National Safety Council survey research published in the Journal of Safety Research, 27% of workers did not report an injury they themselves sustained. If injuries go unreported, near-miss reporting is even harder to treat as a complete dataset. What isn't reported isn't available for analysis.
Incident-precursor analyses have found that 78% of serious incidents were preceded by one or more unreported near misses. The warning may have existed. It just wasn't in the system. The information that could have prevented a serious event is often there before it happens, in conditions and behaviors nobody recorded, which is why more teams now treat leading indicators and near-miss reporting as core safety KPIs.
How to read it: treat the figure as an indication of the pattern, not a universal rate.
The signal problem: when every alert looks the same.
Peer-reviewed studies of alarm fatigue in hospitals report that 74–99% of clinical monitor alarms are non-actionable. Different environment, same human constraint: when everything becomes an alert, people stop treating alerts as signals. The percentage itself describes clinical monitoring, not industrial safety; what transfers is the behavior, not the number.
A system's false-positive discipline, not the length of its detection list, decides whether your team still opens alerts in week 12.
The enterprise problem: the people around your operation.
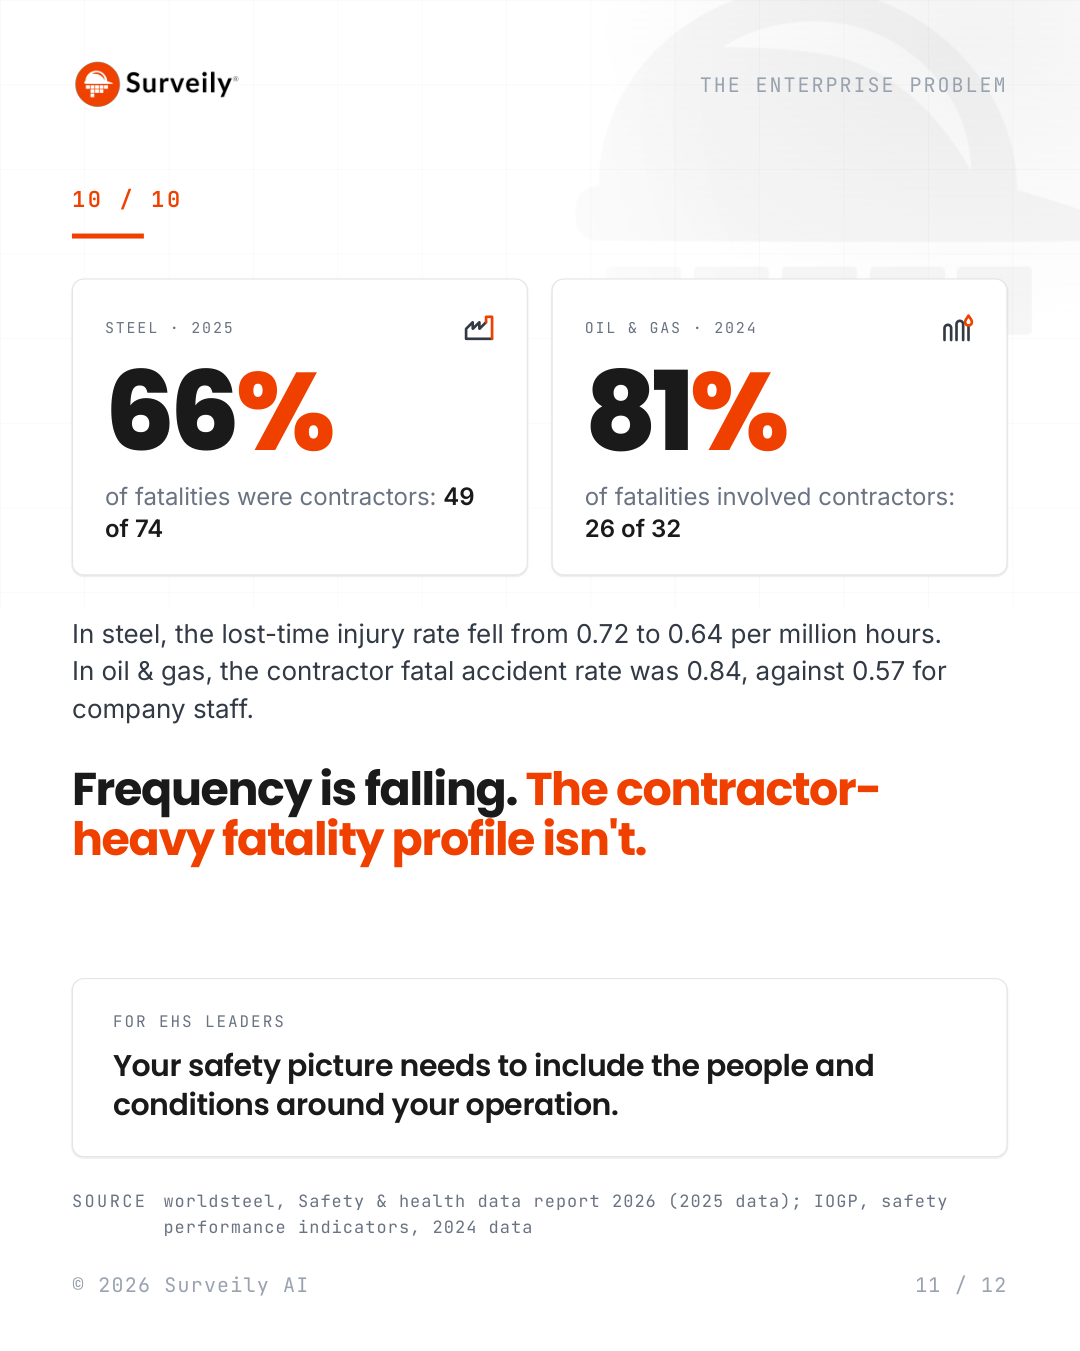
According to worldsteel's 2026 safety data report, 49 of the 74 steel-industry fatalities reported for 2025 were contractors, even as the industry's lost-time injury frequency rate fell from 0.72 to 0.64 per million hours. In oil and gas, 26 of the 32 fatalities in IOGP's 2024 data involved contractors, with a contractor fatal accident rate of 0.84 against 0.57 for company staff. Both are member-reported industry datasets. IOGP's 2025 data, published in June 2026, shows the same split: the total recordable injury rate fell 6%, while fatalities rose to 52 and the fatal accident rate rose 75% on 2024.
Frequency is falling. The contractor-heavy fatality profile isn't. Your safety picture, and your contractor safety program, needs to include the people and conditions around your operation.
The rules around the data.
The CNIL fined Amazon France Logistique €32 million in January 2024. On 23 December 2025 the Conseil d'État reduced it to €15 million: it annulled the finding that some performance-indicator processing lacked a legal basis, but upheld the breaches on data minimization (keeping all indicators for 31 days), information to workers and security.
Minimization and transparency are enforced even where the purpose is legitimate. Architecture choices such as de-identification, minimization and no individual scoring are the durable defense. It is one national case with its own facts, and this summary is informational, not legal advice. For how EU rules apply to AI used at work, see our guide to the EU AI Act and workplace AI.
Every number above describes a population: a continent, an industry, a survey sample. None of them tells you where your own serious-risk exposure sits. Cross-country gaps partly reflect reporting systems; the underreporting figures are perceptions and survey answers, not counts; industry datasets depend on what members report. That isn't a reason to ignore them. It's the reason to treat them as framing, and to make decisions on your own site data.
Macro data tells you where to look. Your site data tells you what to act on. Beyond recordable incidents, the numbers above point to four things worth tracking on your own sites:
And when a safety number reaches the board, ask: what year, what source, what population and what scope? Most importantly: what does it tell us about our actual exposure? Use macro numbers for framing. Use site data for decisions.
We prioritized numbers that can change an EHS decision, and we label each by the kind of source behind it:
Where a figure reflects perceptions rather than measured incidents, or where methodology varies between studies, we say so next to the number.
Eurostat's latest release, published on 25 September 2026, covers 2024: 2.78 million non-fatal accidents at work (accidents causing at least four days' absence) and 3,367 fatal accidents across the EU. Non-fatal accidents fell 1.5% compared with 2023, while fatalities rose 1.4%.
Non-fatal accidents at work are decreasing: Eurostat recorded 1.5% fewer in 2024 than in 2023. Fatal accidents are not following the same direction: they rose 1.4% in 2024, the second Eurostat release in a row with that split.
According to Eurostat, 3,367 people died in accidents at work in the EU in 2024. Construction recorded the most deaths (776), followed by transport and storage (537) and manufacturing (466).
Accident frequency and fatal severity have different drivers. Reducing minor incidents does not automatically address the high-energy conditions, such as vehicle movements, work at height and contractor activities, that lead to fatalities. That is why many EHS teams track leading indicators weighted by serious-injury potential rather than total incident counts.
In Benchmark Gensuite's 2026 EHS Benchmarking Report, 90% of the 260+ EHS professionals surveyed said incidents, hazards and near misses are going underreported, up from 79% a year earlier. This measures perceptions, not a counted rate of missing reports.
In steel, contractors accounted for 49 of 74 fatalities (66%) in 2025, according to worldsteel. In oil and gas, 26 of 32 fatalities (81%) in IOGP's 2024 data involved contractors.
Leading indicators measure the conditions and behaviors that come before harm, such as near misses, unsafe conditions and at-risk behaviors. Lagging indicators, such as recorded injuries and fatalities, measure harm after it has happened.
A near miss is an unplanned event that did not cause injury, illness or damage, but could have. Near misses show where serious harm could occur before it does, which makes them one of the most useful sources of prevention data, as long as they are captured and analyzed.
Beyond recordable incidents, EHS leaders can track exposure-adjusted rates, near misses and unsafe conditions weighted by serious-injury potential, contractor exposure, and the precision of safety alerts: how many alerts the team actually acts on.
After the Digital Omnibus on AI entered into force on 27 July 2026, obligations for stand-alone (Annex III) high-risk AI systems apply from 2 December 2027, and for high-risk AI in regulated products (Annex I) from 2 August 2028. This is informational, not legal advice.
Industry data tells you where to look. Your own sites tell you where risk actually occurs, including the near misses and unsafe conditions that never reach a report form.
See how safety teams surface them on the cameras they already have: behaviors and conditions, not identities.
See how near-miss detection works →
About Surveily: Surveily is a European workplace-safety AI company: on-premises by default, de-identified by default, no biometrics. This article is educational and informational, not legal advice. Deployment outcomes referenced in Surveily materials are always scope-specific, never guarantees.


